How we create cleaned, reproducable data for use in projects and apps
At the City of Amsterdam we deal with many different types of structured and unstructered data. Much of the data is not of high quality and are missing a lot of needed semantics to do proper analytics with.
This guide describes our workflow for creating a reproducable ETL data flow which we use to create better data for analytics and usage in dashboards and maps.
If you want to skip the explanation and want to go directly to our github data-processing repo:
First things first
We use these principles:
- One City, one solution: meaning: We try to write ETL scripts which are the start for a more structural solution, not a one off.
- Create resuable code as Open Source
- Use Git as version control
- Publish the code on github.com/amsterdam as a project with a clear Readme.
- Use Docker to automate, using the backend project methods.
- Use Python as a scripting language for the processing steps. using this python style guide.
- Write code for humans.
- Use a Postgres with Postgis extension Docker image as a data storage and cleaning/merge solution.
- We always try to improve the data quality of the clients data supplier where possible by explaining and showing the benefits of integrating https://api.data.amsterdam.nl endpoints to use basisregistraties to achieve the first principle.
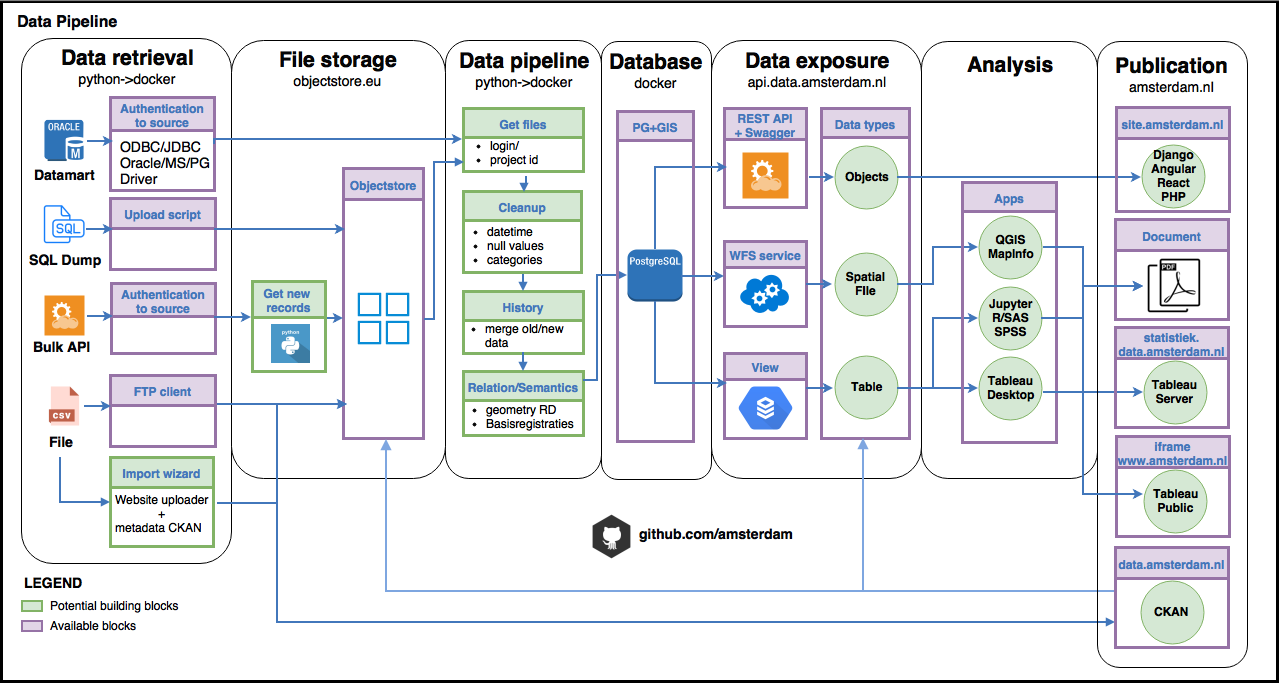
ETL workflow
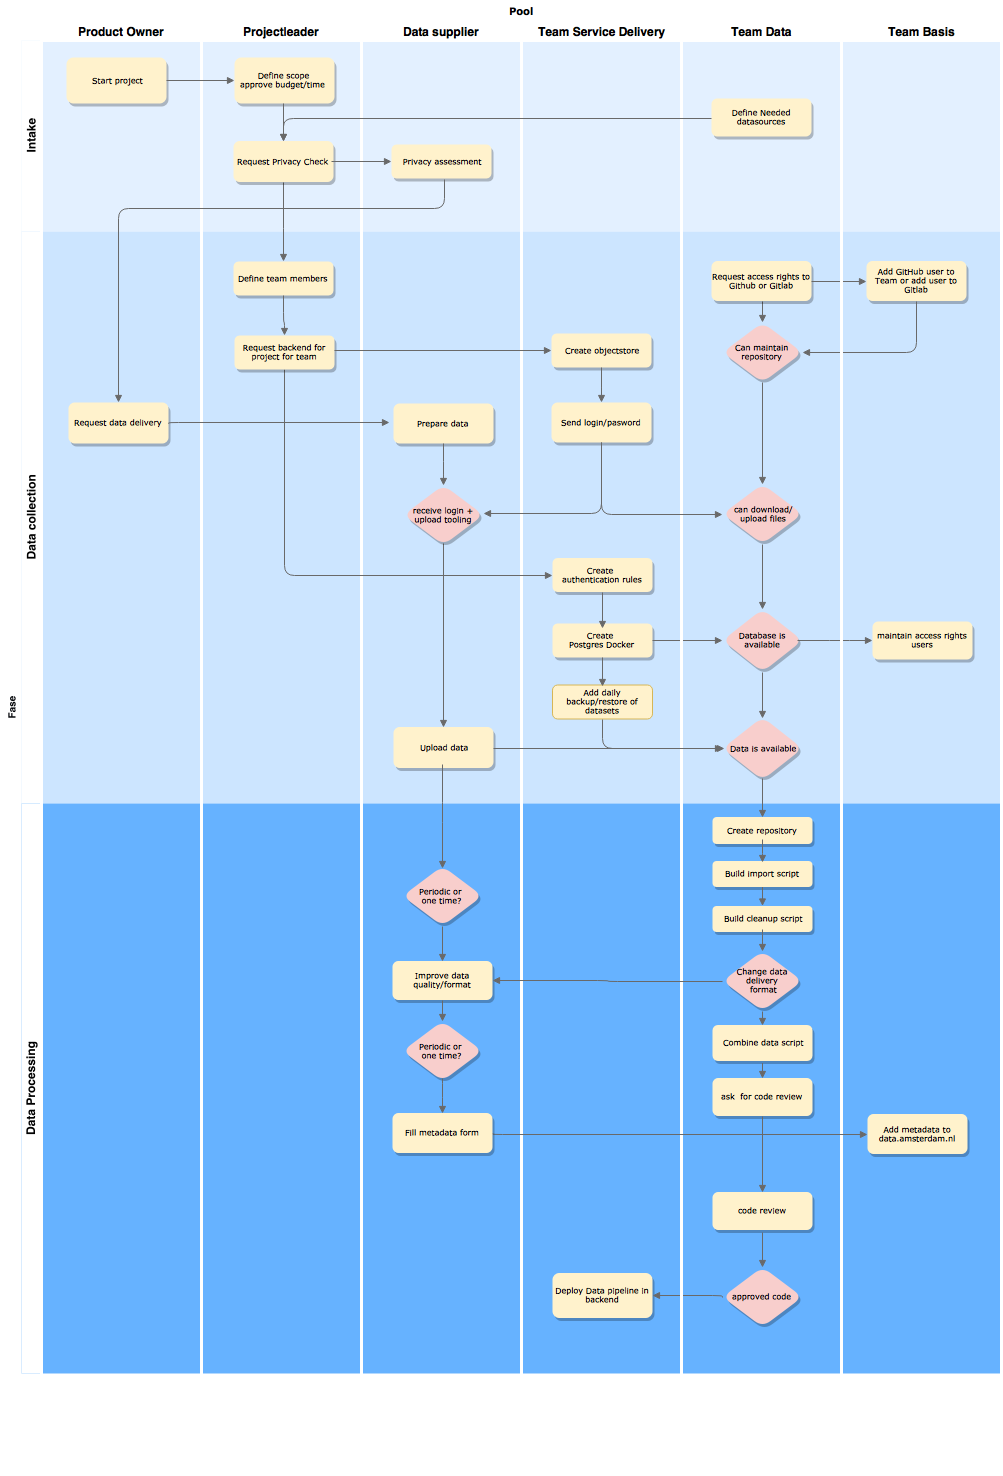
The current roles within the City of Amsterdam are described here with which people and teams we collaborate with to get our data:
The workflow consist of 4 steps:
- Getting the data
- Stage the data
- Clean the data
- Combine the data
1. Getting the data
Much of the data is still recieved by mail in the form of database dumps as tabular or spatial file. That creates a dependancy of the availability of person on the sending and recieving end regarding adding new data to the pipeline.
To solve this an make automation possible, clients are asked to:
A. API/web route
- Create an API token to access the api of the registration system and send the token by mail.
- Send an API token by mail.
- Send PHP login credentials by mail to use the API’s.
- If there is no api available: Ask the owner of the data to create an api on the registration system and help with the api output definitions.
B. Database route
- Recieve an user account for a datamart connection and ask for a ip connection through Motiv if it is not yet available @datapunt.
C. File delivery route
- Let the client upload a database dump periodically to the objectstore with a user/password.
- Send the (database) dump by mail to the data analist.
- Copy the dump on to a protected/encrypted USB stick on location.
Optionally: Send the ip ranges of our organisation to the application maintainers.
Responsibility of the data analist/engineer:
- Store the token/login in the password manager
- Store the userlogin/password in the password manager of the project or team
- Store the dump on the objectstore
2. Staging the data
At the city of Amsterdam we work a lot with spatial data. That’s why we use Postgres with the Postgis extention often to combine, enrich and clean spatial data.
To load the data into the database we use python in a Docker container to create a resuable and production viable import for every project.
A typical flow will look like this:
- Setup the credentials as environment variables.
- Login to objectstore or api.
- Download all records by looping through the API objects, downloading from the objectstore or loading them from a datamart.
- Save the files/objects in dataframe or dict and do some preliminary data cleanup.
- Set the schema if needed.
- Store the dataframe/dict in the postgres database in a schema with the name of the project.
- Add additional tables for semantic enrichment, like neighborhood areas or addresses.
- Create a view for use for analyis or further usage in Service backends like the Django Rest Framwork or programs like Tableau Desktop.
3. Cleaning the data
Most of the cleaning we do beforehand in pure python or using pandas. It the data is large we use mostly sql scripts in a postgres database and clean it with use of additional datasets like:
- Basisregistraties Which are all available as a daily postgres backup or as an API or WFS services.
- pdok.nl The Dutch geo data portal, which also has a nice geocoding api
- NL_Extract A Dutch initiative which publishes monthly many free available dumps of all Dutch addresses as a postgres dump, but also OSM, BRT and BRK and Top10NL.
To connect to these services more easily we made some python modules, which are explained here: https://amsterdam.github.io/data-processing/modules.html
4. Combining the data
After the data is cleaned, we combine the data mostly with postgres using Docker or with pandas dataframes. It depends on the output if it is served back as an API in Django for web services or as a flat CSV file to reuse in other visual programs like Tableau.